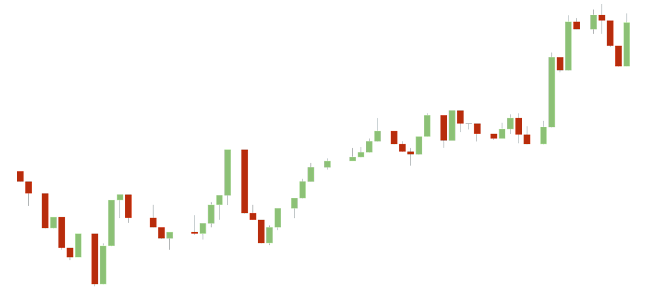
Understanding Candlestick Patterns: A Comprehensive Guide
Candlestick patterns are essential tools in the world of technical analysis, helping traders and investors make informed decisions in the stock market. These patterns provide valuable insights into price movements, trend reversals, and market sentiment. In this comprehensive guide, we will delve into the fascinating world of candlestick patterns, explaining their significance, types, and how to interpret them effectively.
Introduction
Candlestick patterns have been used for centuries in various forms across different cultures. However, they gained prominence in the financial world through the pioneering work of Japanese rice trader Munehisa Homma in the 18th century. Today, candlestick charts are a standard feature on most trading platforms.
What Are Candlestick Patterns?
At its core, a candlestick represents the price movement of an asset over a specified time frame. Each candlestick consists of four main components:
- Open: The opening price of the asset during the time frame.
- Close: The closing price of the asset during the time frame.
- High: The highest price reached during the time frame.
- Low: The lowest price reached during the time frame.
Candlestick patterns are formed by one or more candlesticks in a specific sequence, offering valuable insights into market behavior.
Types of Candlestick Patterns
There are two primary categories of candlestick patterns: bullish and bearish.
Bullish Candlestick Patterns
- Hammer: The hammer pattern appears at the end of a downtrend, signaling a potential reversal. It has a small body with a long lower shadow.
- Bullish Engulfing: This pattern involves a small bearish candlestick followed by a larger bullish candlestick. It suggests a reversal of the prevailing bearish sentiment.
- Morning Star: A morning star pattern occurs during a downtrend and consists of three candlesticks. It signifies a potential bullish reversal.
- Doji: A doji has an equal open and close, indicating market indecision. It can signal both reversals and continuations, depending on context.
Bearish Candlestick Patterns
- Shooting Star: This bearish reversal pattern appears at the end of an uptrend. It has a small body with a long upper shadow.
- Bearish Engulfing: Similar to the bullish engulfing pattern, it suggests a reversal but in a bearish direction.
- Evening Star: Comprising three candlesticks, the evening star indicates a potential bearish reversal during an uptrend.
- Hanging Man: The hanging man pattern appears at the end of an uptrend and warns of a potential trend reversal.
Interpreting Candlestick Patterns
Interpreting candlestick patterns requires a combination of technical analysis and an understanding of market psychology. Traders use these patterns to identify potential entry and exit points. Key points to remember:
- Patterns are more reliable when they occur after a sustained trend.
- Consider other technical indicators and chart patterns to confirm your analysis.
- Risk management is crucial. Use stop-loss orders to limit potential losses.
Conclusion
Candlestick patterns are invaluable tools for traders and investors. They offer insights into market sentiment and potential price movements. However, like any technical analysis tool, they are not foolproof and should be used in conjunction with other forms of analysis.
To become proficient in using candlestick patterns, practice and continuous learning are essential. As you gain experience, you'll develop a better understanding of how these patterns apply to different market conditions. Whether you're a novice or an experienced trader, mastering candlestick patterns can enhance your ability to make informed decisions in the dynamic world of finance.


No comments